MemScope
Live RAM / VRAM Pressure Monitor & Automated AI Watchdog for Windows.
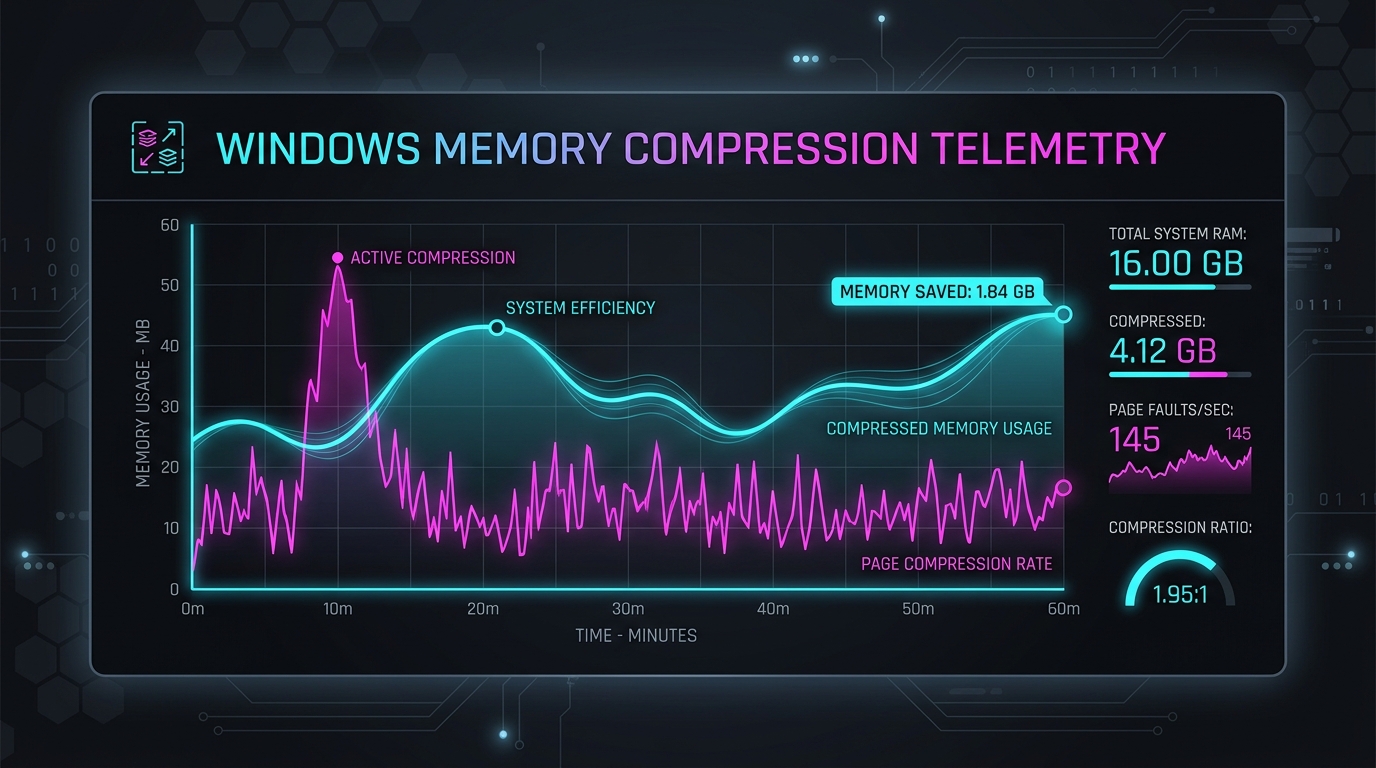
Windows "Memory Compression" working set is a hidden pressure symptom — no stock tool surfaces it next to GPU VRAM and per-process hogs in one place. MemScope makes memory pressure visible, actionable, and self-healing for AI developers.
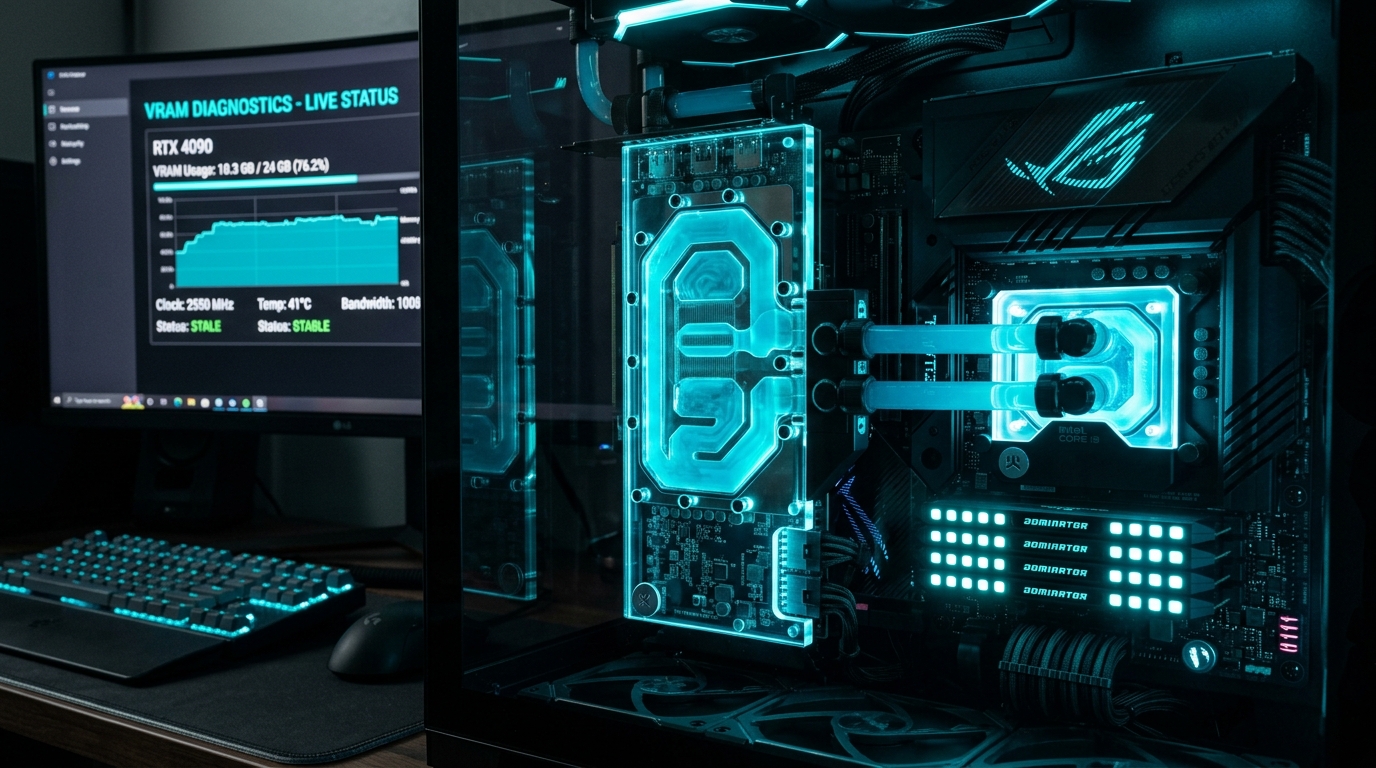
| PID | Process Name | RAM (RSS) | Private Working Set | VRAM Allocation | Watchdog Status |
|---|---|---|---|---|---|
| 18492 | local-llm-engine.exe | 2.1 GB | 24.2 GB | 8.4 GB | ● Active (Monitoring) |
| 21048 | python-inference.exe | 4.2 GB | 16.8 GB | 3.2 GB | ● Auto-Flush Enabled |
| 28804 | dwm.exe (Desktop Window Manager) | 412 MB | 512 MB | 304 MB | System Core |
| 14209 | browser.exe (28 processes) | 3.8 GB | 4.6 GB | 187 MB | User App |
Why MemScope Exists — The Memory Compression Problem
When running local LLMs (Ollama, vLLM, llama-server) or AI image pipelines (ComfyUI, Stable Diffusion), GPU VRAM often spills over into system RAM. Windows responds by aggressively engaging Memory Compression.
- The Hidden Bottleneck: Task Manager shows system RAM as "50% free", but hidden inside that allocation is 15 GB of compressed working sets. When your AI model accesses pages, CPU decompression stalls cause silent 10× generation slowdowns.
- VRAM Truncation Bugs in Win32 API: Standard Windows tools relying on 32-bit WMI
Win32_VideoControllerreport a max of 4 GB VRAM on modern 16 GB and 24 GB graphics cards (such as high-VRAM AMD or NVIDIA GPUs). MemScope uses native 64-bit DXGIIDXGIAdapter::GetDesc()calls to surface true physical VRAM bounds. - Process-Level VRAM Allocation: MemScope maps Windows performance counters (
\GPU Process Memory(*)\Local Usage) directly to active process IDs so you can instantly pinpoint which AI model container is hoarding VRAM.
Key Architectural Features
⚡ Real-Time Pressure Index
Derives a unified 0–100 Memory Pressure Index calculated from compressed MB, available system RAM, pagefile swap rates, and rate-of-change flags (Idle, Light, Moderate, High, Critical).
🤖 Automated AI Watchdog
Monitors local AI servers (`ComfyUI`, `llama-server`, `Ollama`). Automatically triggers memory working set flushes (`POST :8000/free`) or restarts deadlocked processes before OOM crashes occur.
🖥️ Mini HUD Overlay & Tray Icon
Includes a frameless, always-on-top draggable mini-overlay (~220×64px) and color-coded system tray icon so you can monitor VRAM while working in full-screen IDEs or 3D viewports.
📦 Single Portable Binary
Packaged as a standalone Windows executable (`MemScope-v1.1.0.exe`). Zero installation, zero administrative registry clutter, and zero background telemetry.
Feature Matrix Comparison
| Feature | MemScope | Windows Task Manager | Process Hacker / System Informer | MSI Afterburner |
|---|---|---|---|---|
| Windows Memory Compression Counter | ✓ Explicit | Hidden in sub-tab | Raw counter only | ✗ Unsupported |
| 64-bit DXGI VRAM Total (>4GB GPUs) | ✓ True VRAM | ✓ Supported | ✓ Supported | ✓ Supported |
| Per-Process VRAM Mapping (PID → GPU) | ✓ Live Per-PID | Shared GPU column | ✓ Supported | ✗ Unsupported |
| Automated ComfyUI / LLM Watchdog | ✓ Built-in | ✗ Unsupported | ✗ Unsupported | ✗ Unsupported |
| Always-on-Top Mini HUD Overlay | ✓ Draggable HUD | ✗ Unsupported | ✗ Unsupported | Requires RivaTuner |
Download & Build Options
MemScope is published as free software under the Apache License 2.0 and hosted on GitHub (akketix/memscope) ↗. You can download the pre-compiled single binary or run directly from source using Python 3.11+ and uv.
Open-Source Dependencies & Licenses
MemScope relies on open-source libraries that make fast, native Windows hardware diagnostics possible. All dependencies use permissive licenses:
| Component / Dependency | Purpose in MemScope | Open-Source License |
|---|---|---|
| MemScope Core | Application logic, Watchdog, Pressure Index algorithm | Apache License 2.0 |
| PySide6 (Qt6) | Desktop GUI controls, tray icon, and mini-overlay HUD | LGPL v3 |
| psutil & pywin32 | Process memory RSS, PIDs, and Windows PDH counters | BSD 3-Clause / PSF |
| pyqtgraph | Real-time time-series pressure history plotting | MIT License |
| FastAPI & uvicorn | Local REST API server and Prometheus metrics endpoint | MIT / BSD 3-Clause |
| LibreHardwareMonitorLib | Optional in-process hardware sensor reader (temp/fans) | Mozilla Public License 2.0 (MPL) |